Viewline Report Output
Viewline has been designed to not only make CCTV survey reporting straightforward and standard compliant but also to produce rich reports that are easy to understand by the end user. To enable this, we use colour coding, at a glance overviews, report interpretation guidance and an observation guide.
More information on each of these design aspects and more, can be found below.
Wondering what good CCTV reporting practice should be or have further questions? Our Best Practice Guide should help.
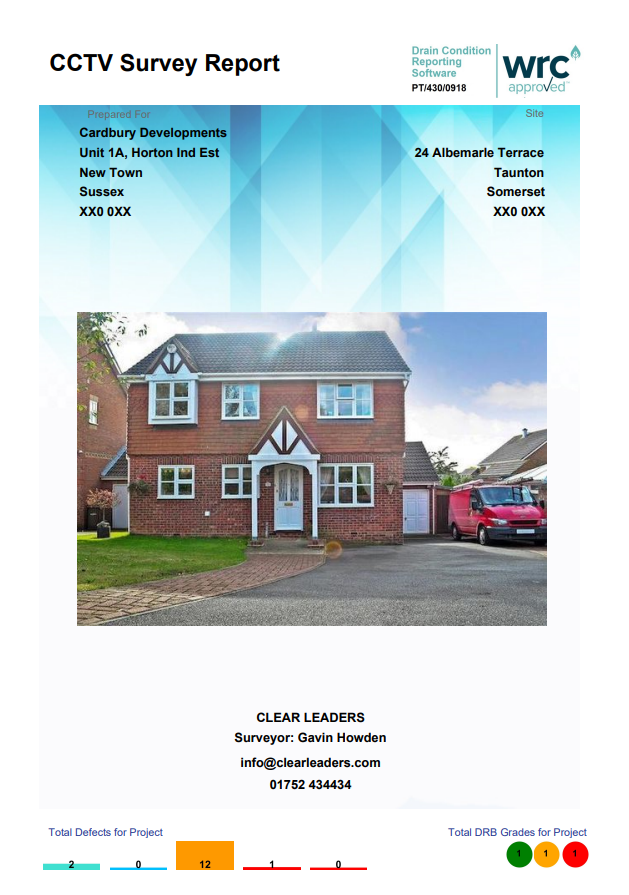
Cover Page
This is the front page of a standard Viewline report. The top right area consists of our WRc (Water Research Centre) approval for our reporting format. WRc Approval describes Viewline 550 CCTV sewer inspection software as a program designed, ‘… for the reporting of observations and defects in domestic drainage systems. The program uses the domestic drainage codes specified in the Manual for Sewer Condition Classification 5th Edition (MSCC5) and EN13508-2.’ Our certificate details can be found here.
The site address and client details can be found just below. An image of the property being surveyed can also be added.
The bottom section includes the drainage contractor’s details. Below this information there is some colour coded information on the condition of the drainage sections surveyed.
The lower right corner contains grading information for each drain run surveyed. The grading system used is based on the WRc Drainage Repair Book (DRB) grading system. Green represents a serviceable drain, amber relates to a drain that may require attention and red relates to a drain that requires remedial works. The numbers represent the number of each of these graded drains. This provides an at a glance indication of the condition of surveyed drains on the first page of the report.
The colour coded information located to the bottom left indicates the total number of recorded defects for the project and is based on totalling the severity score.
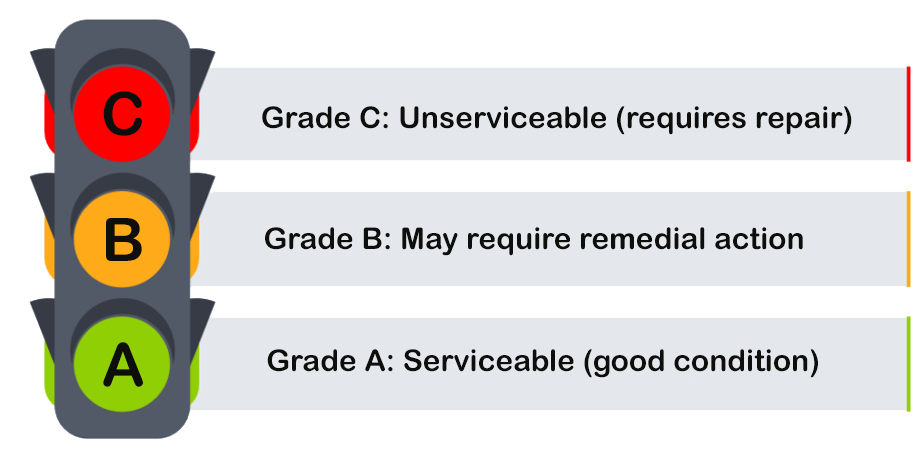
What does DRB grading mean?
DRB grading is based on WRc recommendations on drain serviceability. When a drain is in good condition with no issues that will affect the operation of that drain it is deemed serviceable. A serviceable drain is given a Grade A. If there are issues with the drain likely to affect the drain’s operation, then it is given a Grade C, which means the drain is unserviceable and requires repair. The area in between, where the defect might require repair in the near future but is still relatively serviceable is given a Grade B.
We have added to DRB grading by using a traffic light colour coding system whereby Grade A is green, Grade B is amber and Grade C is red. This is aimed to enable clients to understand the general condition of their drainage system easily.
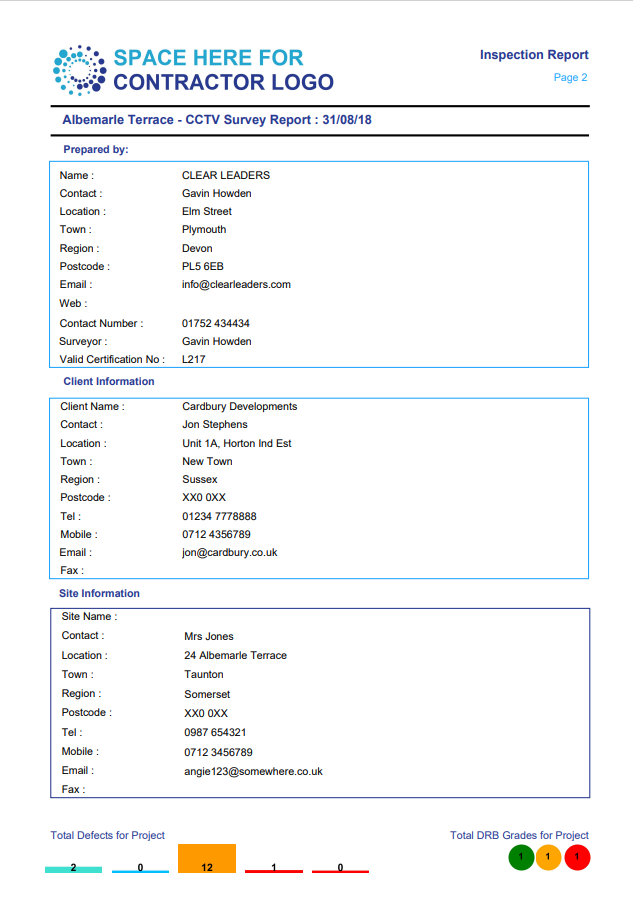
Project Page
This page contains the project information, which includes Contractor details, Client Information and Site Information. There is also an area at the top of the Project Page for the project name and date of report. The contractors logo can also be located at the top left of the page.
Colour coded information on total number of defects and DRB grades is duplicated at the bottom of the report. This follows though out the report apart from each individual section. On these page we provide the automated grade for that section.
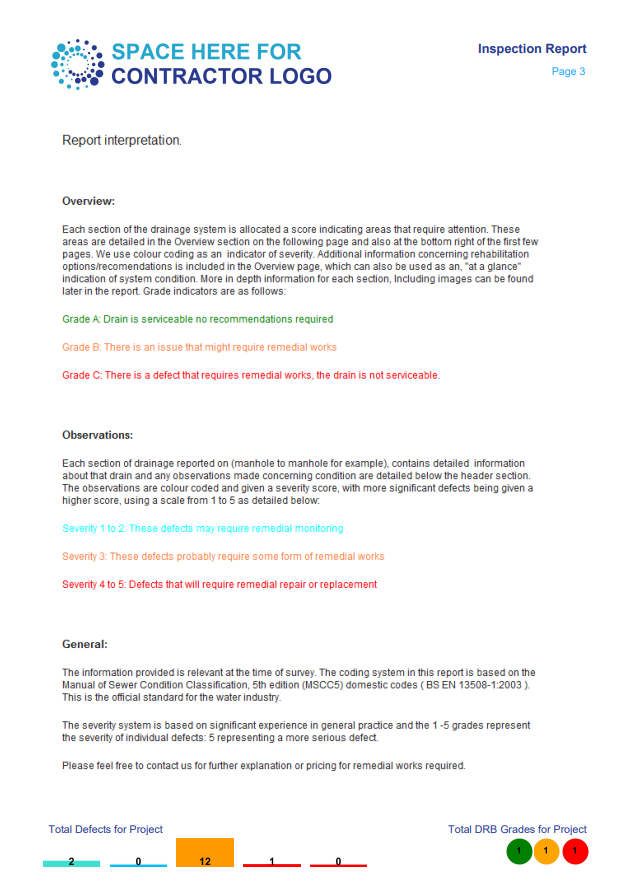
Report Interpretation
Viewline is preloaded with this Report Interpretation. Most contractors tend to use this default as it adequately explains the report format and automated grading systems used. However, it is completely editable.
The interpretation is divided into three sections and describes the high level functions of the report to the end user (the report viewer). Our aim is to make reporting as simple as possible for the drainage contractor and easy to understand for the final report viewer.
We understand that CCTV reports are quite specialist and can appear quite difficult to comprehend. We have used very simplified traffic light colour coding, the is interpretation, an Overview page and an Observation guide with a view to counteracting this. Our format also ensures report uniformity based on agreed reference points.
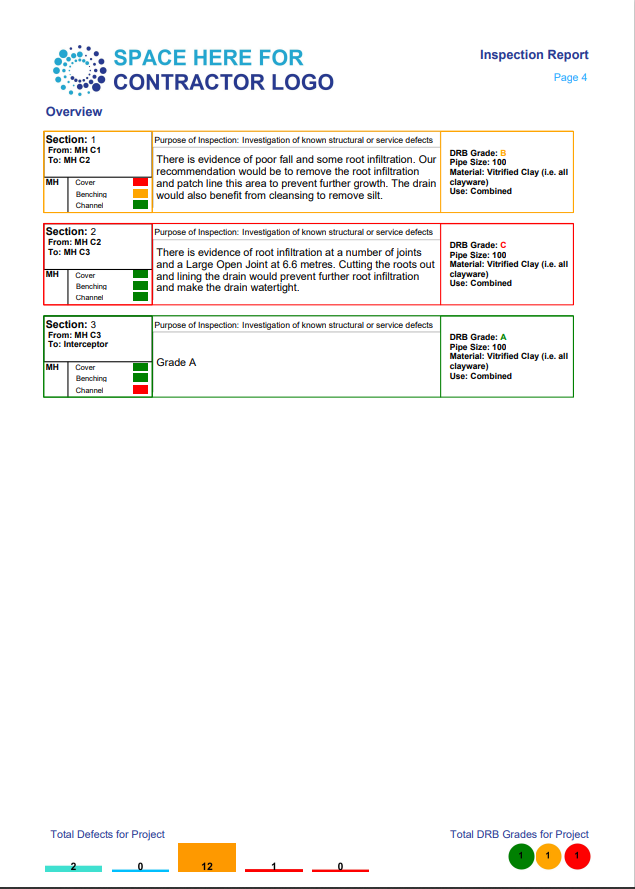
Overview Page
The Overview page provides an at a glance preview of the condition of the the complete survey broken down by section.
Again Viewline provide colour coded indications as to drain system condition. In the example to the right, Section 1 indicates a drain in Grade B (indicated with the colour amber) condition with a manhole issue (indicated with a red block). There is additional room to include a short description of the issues affecting the drain.
Section 2 describes a Grade C graded drain, indicated using red, that has a good condition manhole, indicated with a green block.
Where the term ‘Misconnection’ is used this indicates that the drainage system is separate and the foul water has been connected to a surface water drain.
As a double check it should also be noted that the ‘Total DRB Grades for Project’ section located bottom right should tally with the Overview sections.
The Overview page enables end users to identify the areas of the drainage system that require attention quickly.
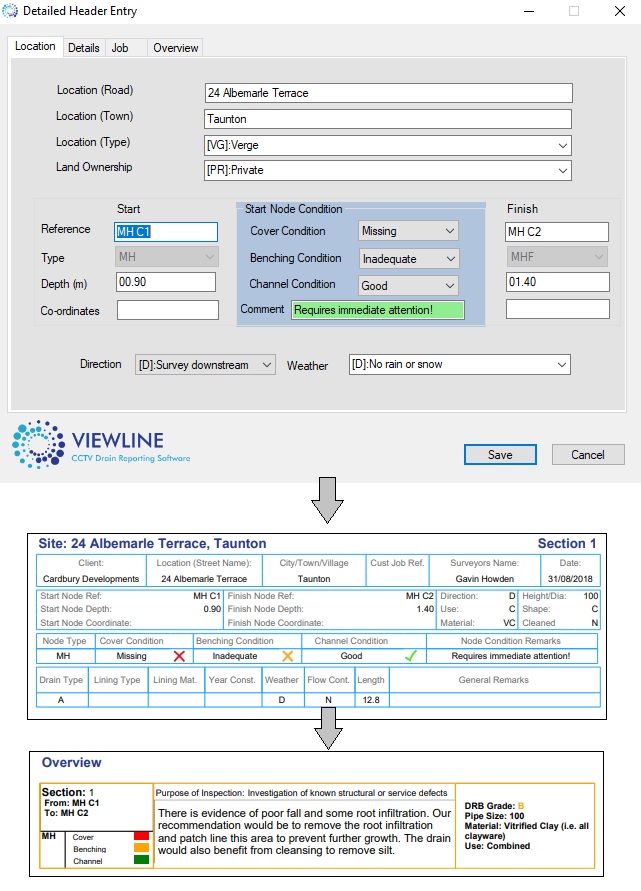
Manhole (Node) Condition
Our reports include a small section to note basic information on the condition of the start manhole or inspection chamber’s condition, (known as a start node) .
The start node is broken down into three structural components: the cover (removable access lid), the benching (normally the sand and cement haunching that sits between the manhole walls and the channel pipes) and the channel ( the half pipes found in the base of manhole that allow flow from the inlet to the outlet).
Each component’s condition can be identified using four descriptions: Good, Inadequate, Poor and Missing. An additional comment can also be added for further clarity. This information is added in the Section Header details as shown in the example image.
When the report is printed to PDF, this information is relayed to the header information using the same terminology and colour coded ticks and crosses for a more visual cue. The short comment/remark is also transferred.
The start node condition is also transferred to the Overview section for ‘at a glance report understanding’. Here, once more, we use traffic light colour coding to highlight each component’s condition.
This means that the report viewer can quickly determine the condition of both the drain and the start node from the overview detail and move to the appropriate Section without having to wade through the whole report looking for areas of interest.
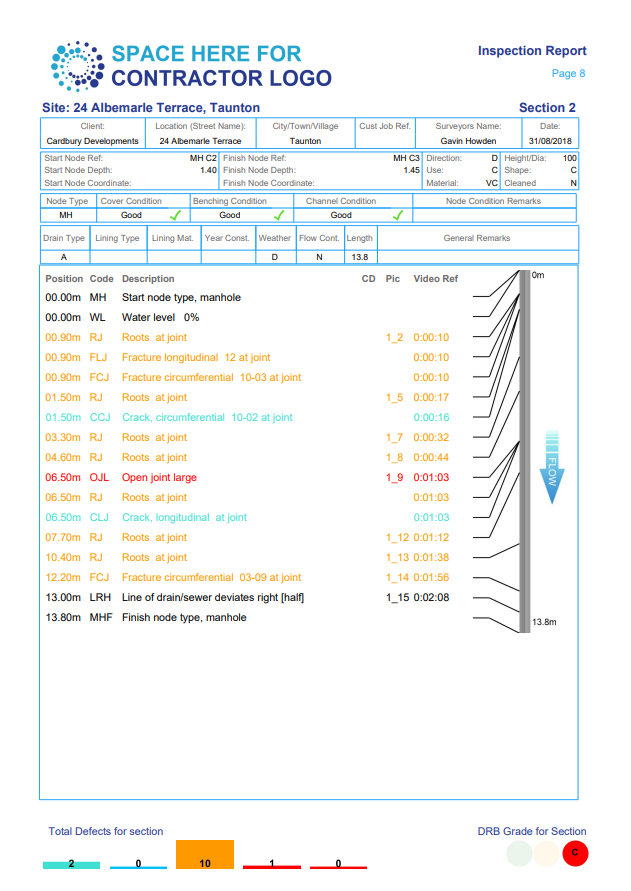
Section Report
The upper section detail contains the header information. This information is based on WRc header recommendations. This includes base information on the pipe being surveyed such as the start and finish node references, direction, use, material and dimensions. The Viewline report header format also includes basic manhole condition information concerning cover, benchwork and half channel condition.
The observation detail is located beneath the header information includes a pipe line graphic with indications as to the position of each observation. To the left of this is the position of the defect or observation, the associated code and the long hand description of the observation. If an image has been captured, its reference number is then included next to the position video reference number. Defects are also colour coded according to the DRB, so amber if Grade B and red if Grade C.
The lower right corner contains grading information for the section. The grade is based on the highest severity defect, in this case the highest graded defects are all Grade B. This colour coded section grade was initially placed in the bottom right because we knew that hard copy report viewers tended to flick through reports looking for sections with issues.
The colour coded information located to the bottom left indicates the total number of recorded defects for the section and is based on severity scores.
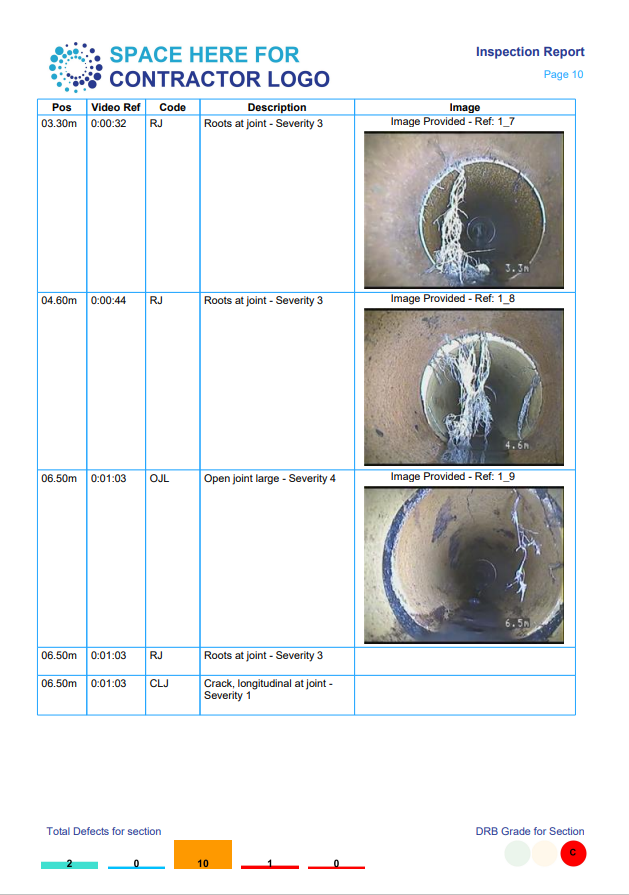
Observation Image Page
This page shows the images taken by the operator of defects or any area of interest. These are referenced in the previous section report and are designed to show the defect for easier interpretation. The distance position, video reference position, code and long hand description are also shown.
It is also possible to show all the observation images at the end of the report.
Again the lower right corner contains grading information for the section. The grade is based on the highest severity defect, in this case the highest graded defects are all Grade B.
The colour coded information located to the bottom left indicates the total number of recorded defects for the section and is based on severity scores.
The report will then show each section surveyed in this fashion, (section header followed by section header) until the final surveyed section.
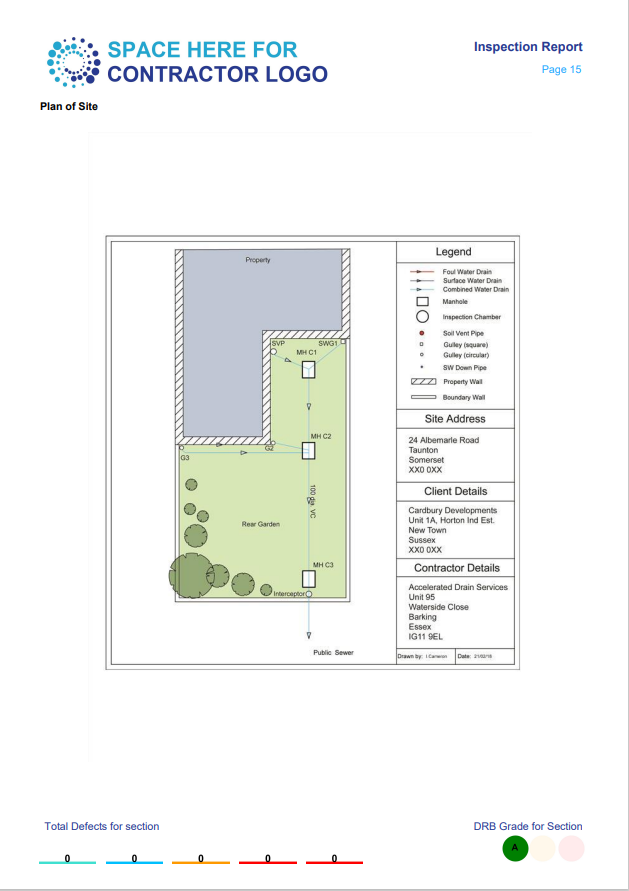
Site Plan Page
This page is designed to hold an image of the site plan.
Viewline provide a drawing package called DrainDraw that enables the creation of a drainage system drawing with a legend. This drawing has been created using this application. DrainDraw integrates with Viewline so that project information can populate the address, client and contractor fields.
However, any standard format image file (jpg, png, bmp) can be uploaded.
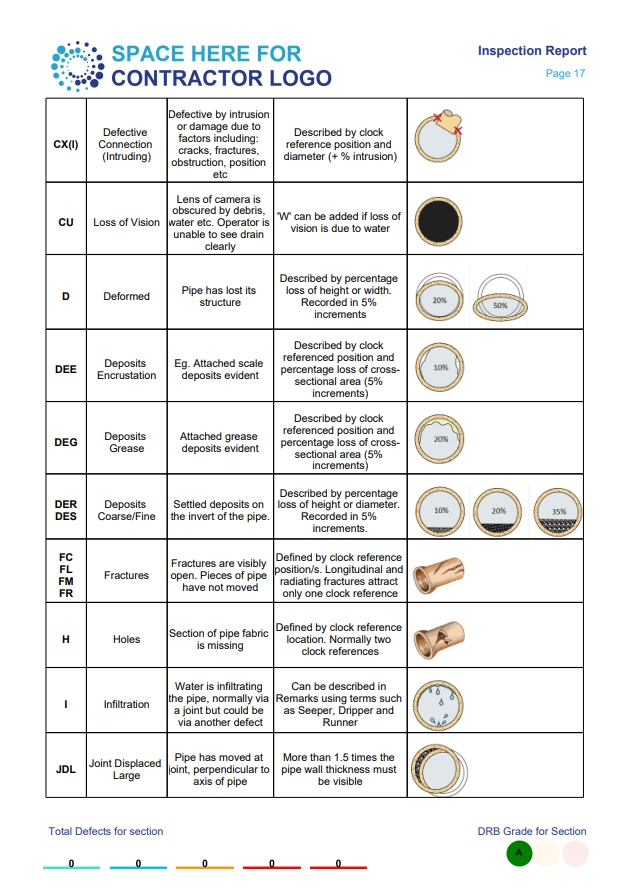
Observation Guide
This is designed to help clients and customers understand more detailer and technical aspects of the report.
Viewline refers to the Manual of Sewer of Condition Classification and uses the standard domestic/light commercial code base. These are shortened into a code form for speed of use. Viewline also indicates the long hand description within the standard report. This is a relatively industry based classification system that drainage contractors should understand and adhere to. However, it is not expected that the end users of reports necessarily understand the detailed aspects of a report. This is where the Observation Guide comes into play.
Viewline already provides the longhand description and an image as a description of the defect. The Observation Guide expands on this to greater improve the end user’s understanding. An expanded description is included with a detailed explanation of the attributes of that observation and a drawing that is designed as a visual guide.
Viewline’s primary function is to make drainage condition reporting simple for the contractor and easy to understand for the end client and the Observation Guide improves that ability.
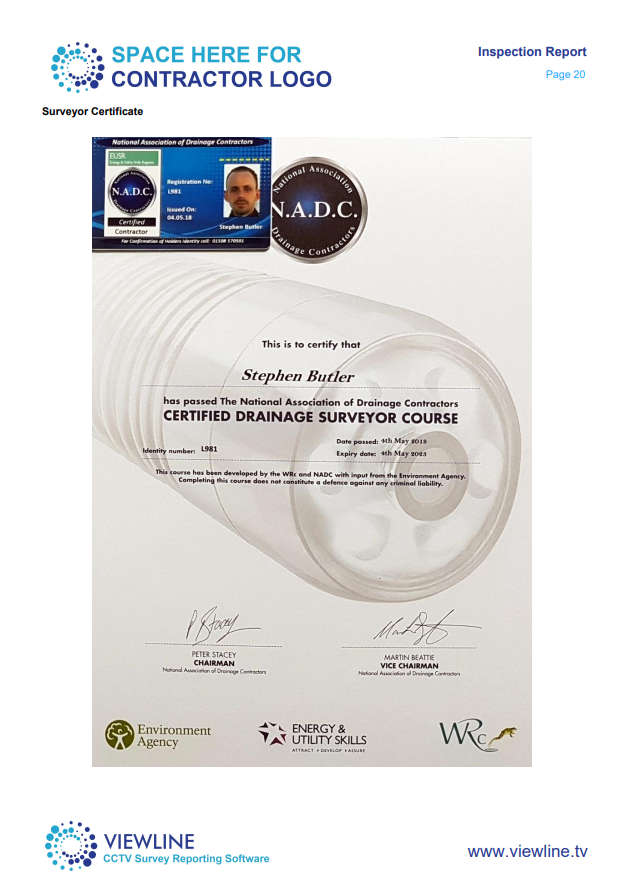
Survey Certificate Page
Even though Viewline have developed a report output that is standard compliant, easy to use and easy to understand, there is still the potential of user error. Using a trained and experienced operative or contractor helps to remove description errors. After all, even though there are objective observation and defect descriptions, the interpretation of an image remains subjective.
A lack of approved training and certification is likely to lead to mistakes being made that might mean that the wrong remedial recommendation is made. This in turn can lead to unnecessary costs as well as being detrimental to the reputation of the contractor.
To further improve the authenticity and quality of a report and its recommendations we have included an area where training certification can be uploaded. This will add another level of confidence for the report viewer.